ウィルス分布 データ作成
分布の作成
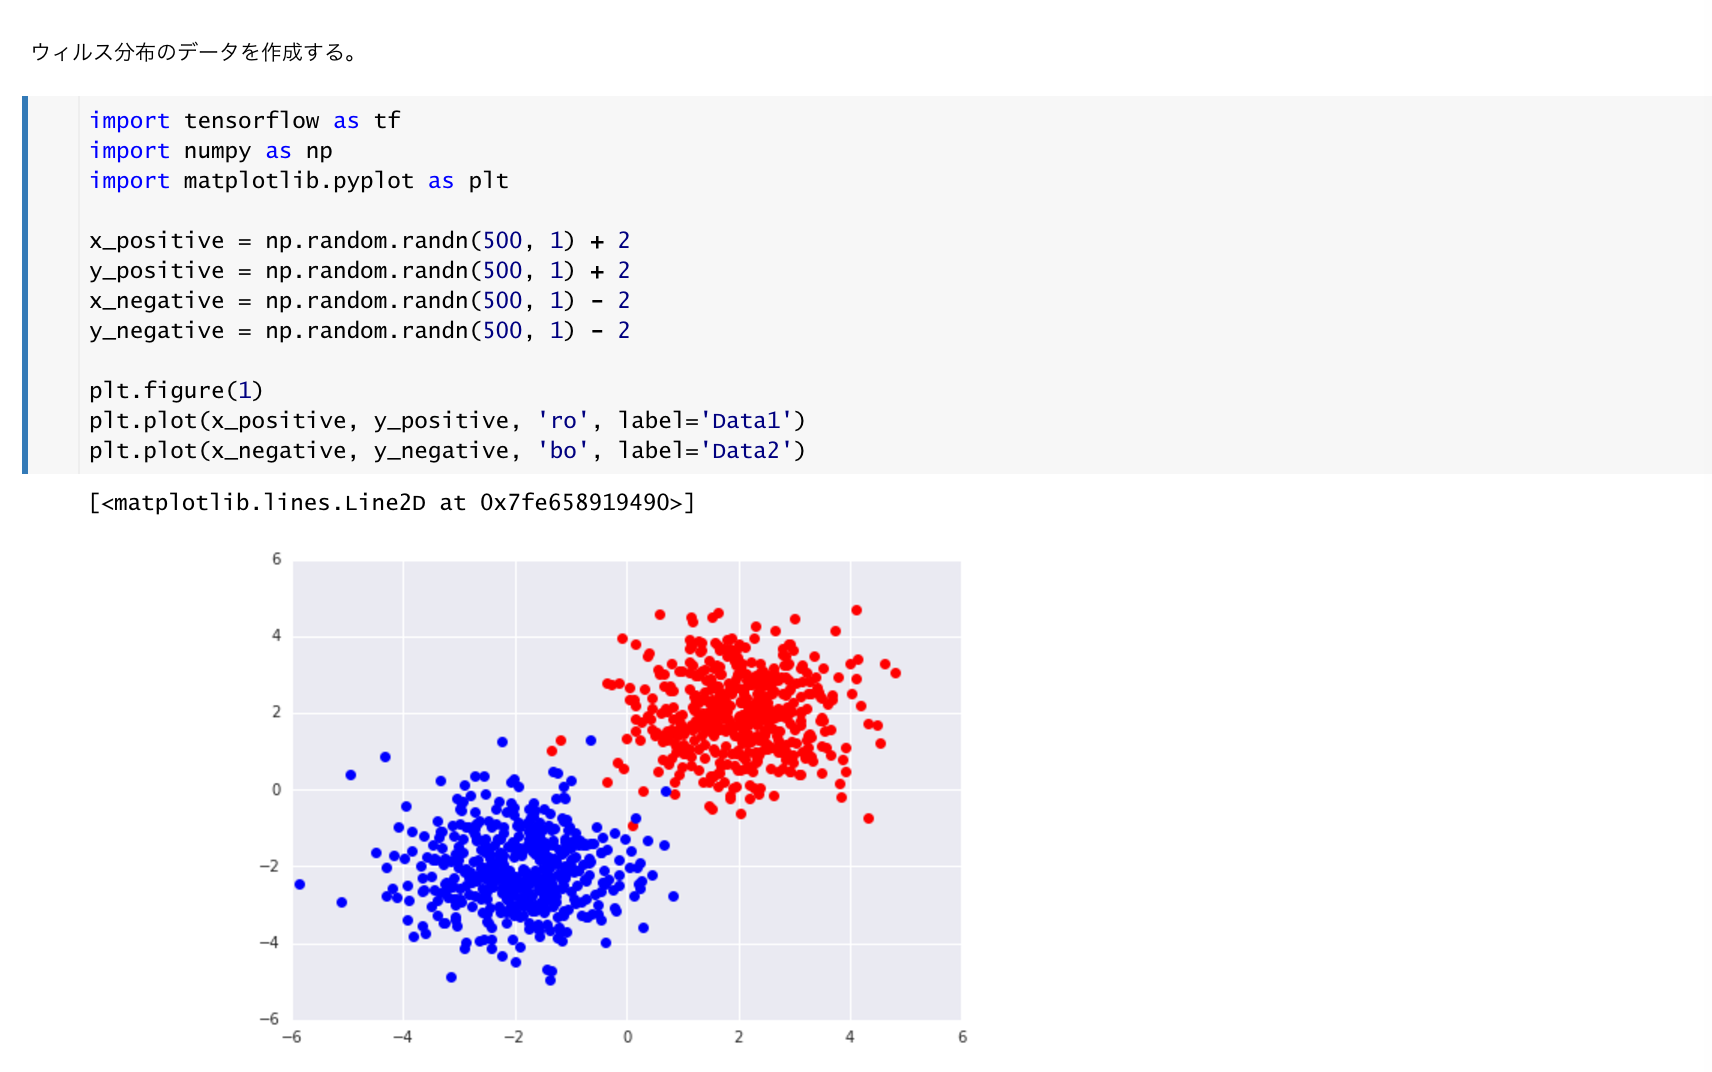
ウィルスの感染分布を作成します。赤が感染済み、青が非感染で正規部分布をx,y座標ともに中心点から(2,2)づつずらして正規分布をずらす。
#!/usr/bin/env python
# -*- coding: utf-8 -*-
# TensorFlow r1.0.0
# Python 2.7.6
import tensorflow as tf
import numpy as np
import matplotlib.pyplot as plt

x_positive = np.random.randn(500,1) + 2
y_positive = np.random.randn(500,1) + 2
x_negative = np.random.randn(500,1) - 2
y_negative = np.random.randn(500,1) - 2

plt.figure(1)
plt.plot(x_positive, y_positive, 'ro', label='Data')
plt.plot(x_negative, y_negative, 'bo', label='Data')
plt.show()
データの作成
次に、現在 1x500の行列である、x_positive,y_positiveとx_negative,y_negativeを2x1000の1つの配列であるVIRUSに格納する。
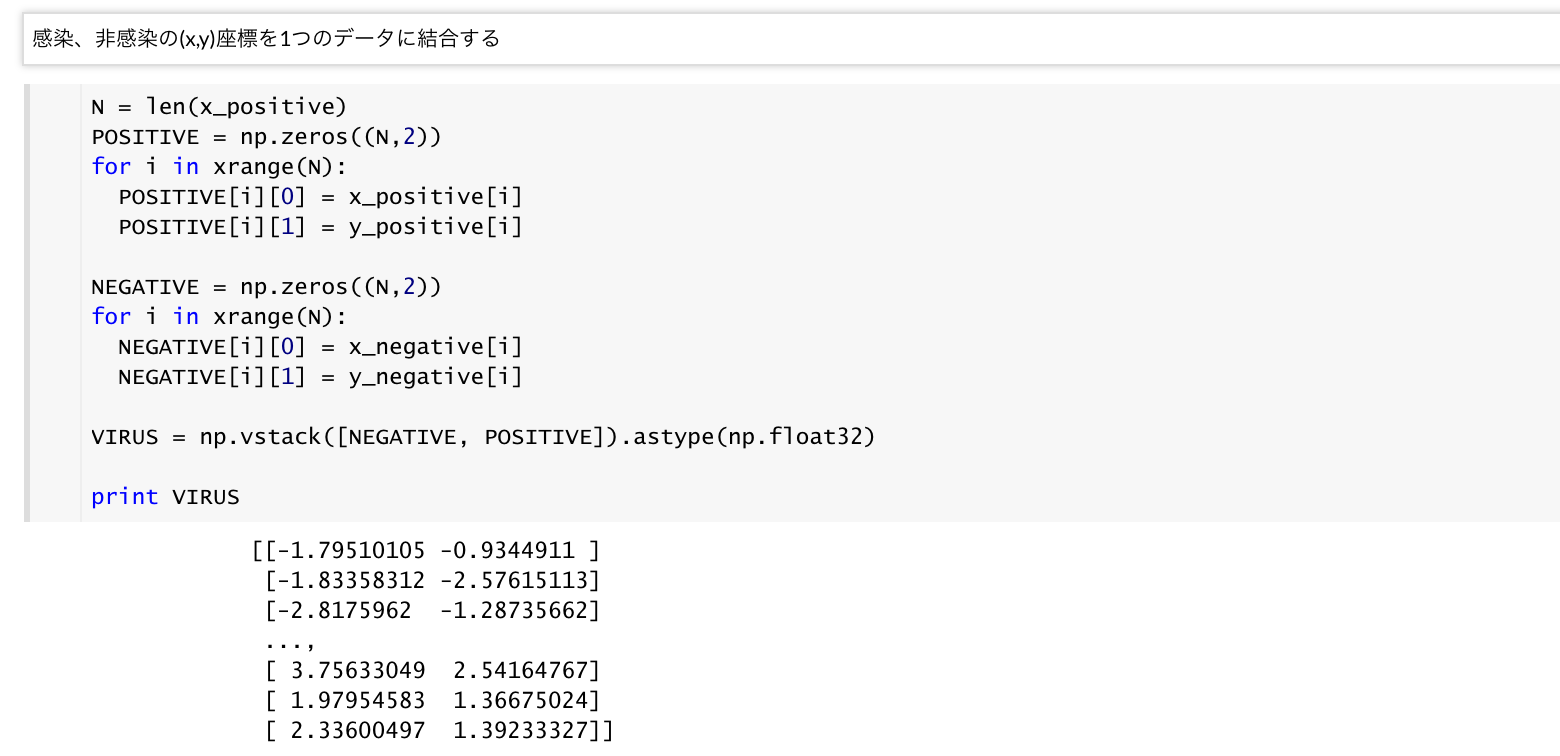
N = len(x_positive)

POSITIVE = np.zeros((N,2))
for i in xrange(N):
    POSITIVE[i][0] = x_positive[i]
    POSITIVE[i][1] = y_positive[i]

NEGATIVE = np.zeros((N,2))
for i in xrange(N):
    NEGATIVE[i][0] = x_negative[i]
    NEGATIVE[i][1] = y_negative[i]

VIRUS = np.vstack([NEGATIVE, POSITIVE]).astype(np.float32)
感染/非感染のラベル付け
また、感染状況を表す行列 STATEを2x1000行列で作成し、感染している場合は[1,0], 感染していない場合は、[0, 1]を代入する。前の項目で、前半500個を感染済み、後半の500個を非感染として2x1000行列に格納しているので、前半の500個を感染済みとして[1,0]とし、後半の5000個を未感染として[0,1]を代入する。
[1,0] 感染 [0,1] 非感染
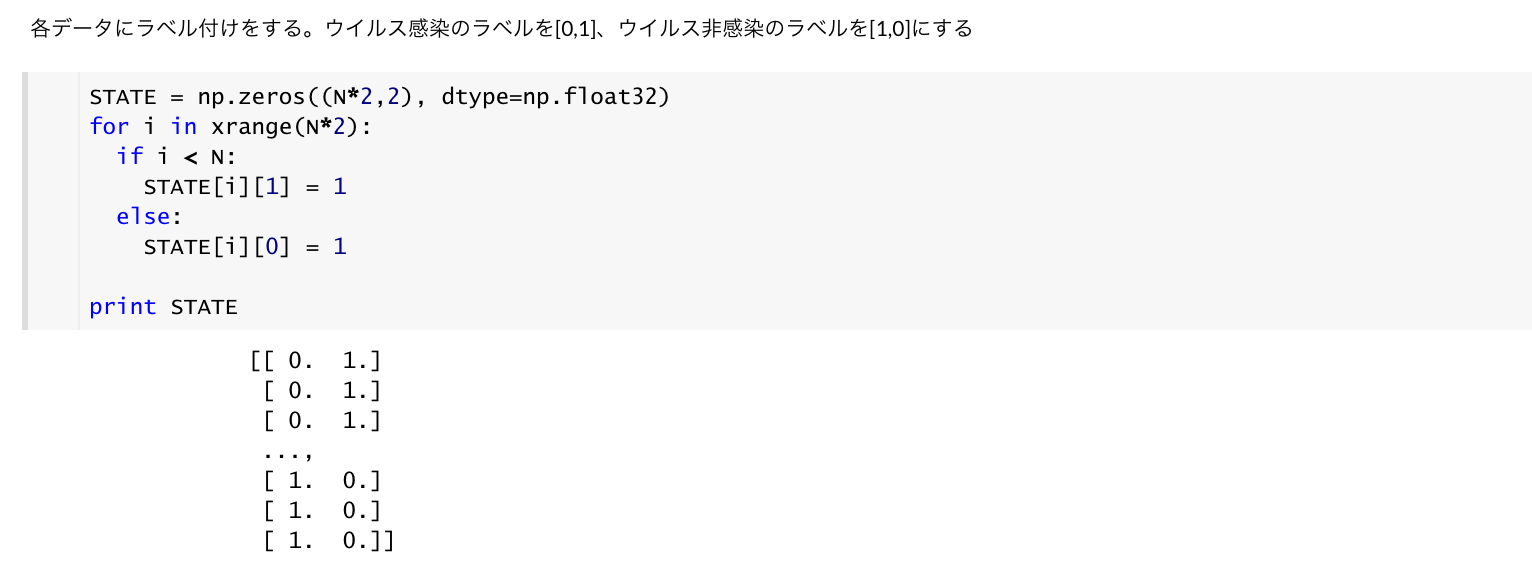
STATE = np.zeros((N*2,2))
for i in xrange(N*2):
    if i < N:
        STATE[i][0] = 1
    else:
        STATE[i][1] = 1
Notebook
https://github.com/FaBoPlatform/TensorFlow/blob/master/notebooks/virus01.ipynb